Reducing Chronic Homelessness in San Francisco.
Chronic Homelessness Initiative
2017 - 2022
Launched in 2017, the Chronic Homelessness Initiative (CHI), powered by Tipping Point, was the largest private investment to address chronic homelessness in San Francisco’s history. A five-year initiative ending in June of 2022, CHI was driven by collaborative efforts between local government, nonprofit service providers, individuals with lived experience, and philanthropy to create lasting change.
$100 Million Invested
Over the course of five years, Tipping Point targeted investments in three specific areas:
Create More Housing
Prevent Homelessness
Optimize Public Systems
Initiative Overview
CHI’s five-year effort was aimed at reducing chronic homelessness in San Francisco by 50%. When Tipping Point started CHI in 2017, we estimated that if we added 1,400 new PSH (permanent supportive housing) units on top of the 800 new PSH units planned by the City, we would see a 50% reduction in chronic homelessness by the 2023 PIT Count. In the years that followed, CHI invested in a diverse range of solutions for people who were chronically homeless as well as those at risk of chronic homelessness. We exceeded our goal by launching programs leading to 1,700 new placements into PSH, plus hundreds of other housing units for unhoused San Franciscans. The City has likewise exceeded its goal, creating more than 1,000 PSH units. However, there were unanticipated increases in the number of people experiencing chronic homelessness, especially between 2017 and 2019. As a result, we do not expect to reach the 50% goal by January 2023.
CHI made incredible strides toward cutting chronic homelessness in San Francisco. In addition to funding new housing and behavioral health strategies, CHI piloted new strategies that have started to change the way that the City of San Francisco responds to homelessness. Our efforts have also developed accountability within the City to encourage the response system to be more transparent, equitable, and strategic.
Investment Evaluation
Since the launch of CHI in 2017, the Urban Institute, an internationally-recognized research institution, evaluated the initiative to measure progress toward the goal of cutting chronic homelessness in half by 2022, and the impacts of specific programs CHI launched. The following evaluation analyzes the final results of Tipping Point’s investment and details key learnings and successes of the largest private investment to address homelessness in San Francisco’s history.
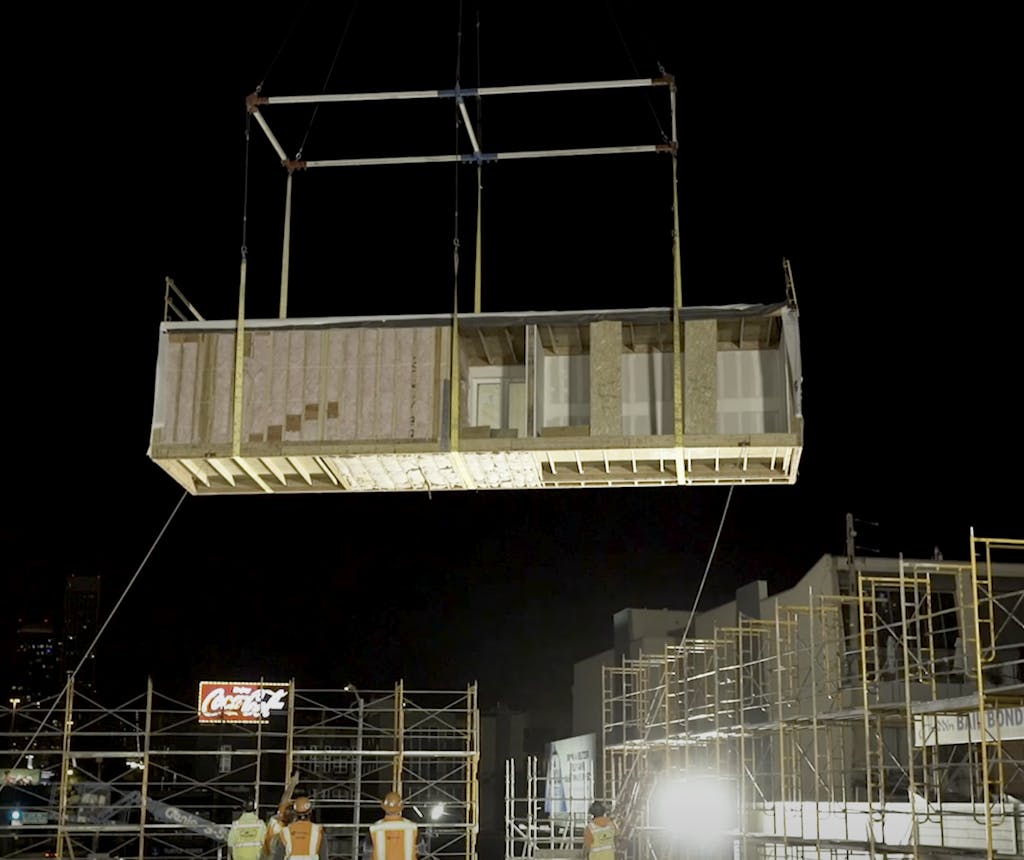
PROJECT SPOTLIGHT
Developed Housing Faster + More Cost Efficiently
We acted nimbly to pilot new strategies while keeping a focus on long-term, sustainable impact. We created the prototype for how to build permanent supportive housing (PSH) at two-thirds the cost and in half the time as the previous standard.
PROJECT SPOTLIGHT
Promoted New Solutions to Increase Housing
We provided seed capital to launch a 200-person flex pool that rents vacant private units to individuals experiencing homelessness and provides case management and supportive services. The City will pay the ongoing cost of housing for all of the flex pool pilot participants and plans to spend over $50 million to expand the program to over 1,000 individuals by the end of 2023.
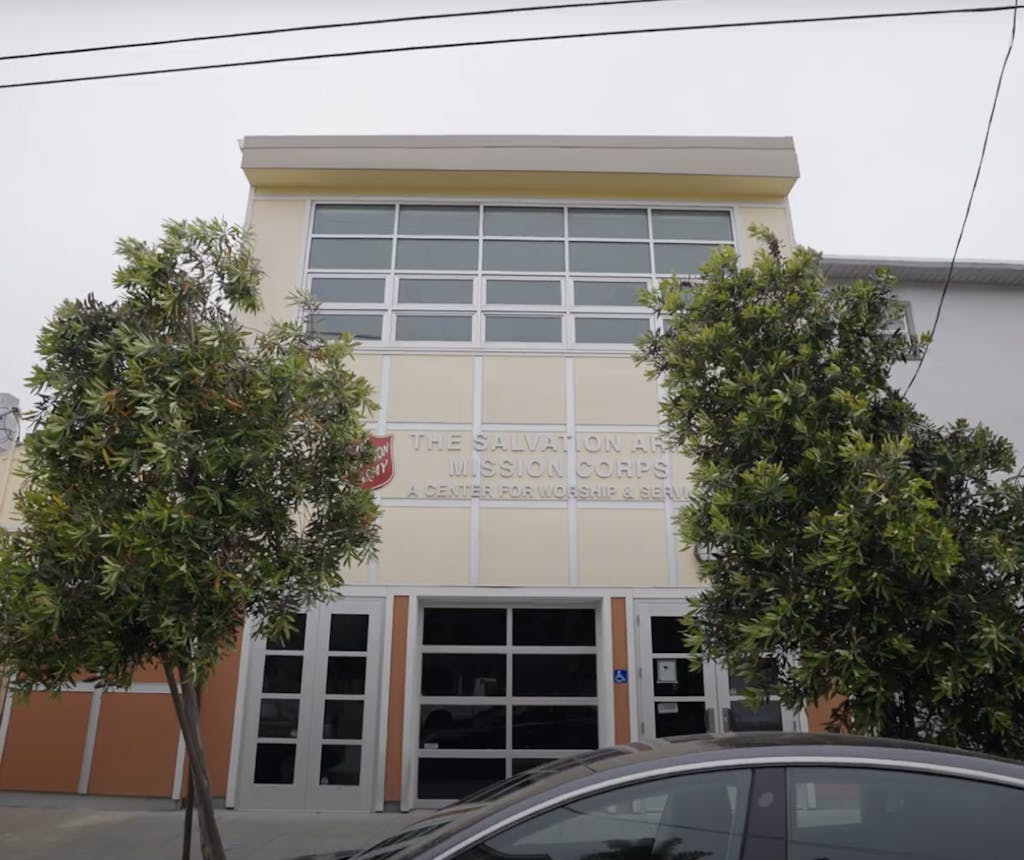
PROJECT SPOTLIGHT
Addressed Behavioral Health Needs
We funded Hummingbird Valencia, a psychiatric respite center in the Mission District, which added 28 new overnight beds for those experiencing homelessness and behavioral health crises. This building, along with the bed optimization report—another CHI-funded effort—helped improve the City’s ability to make planning decisions about the type and number of treatment beds needed across the entire system of care.

PROJECT SPOTLIGHT
Moved 200 People into Independent Apartments
We piloted the Moving On Initiative, which moved almost 200 people who no longer needed supportive services out of PSH and into their own independent apartments subsidized with federal vouchers, freeing up space in PSH for residents who needed supportive services.
CHI Grantees
3rd Street Youth Center and Clinic
Abode Services
All Home
Bay Area Community Services
Bay Area Legal Aid
Bayview Hunters Point Foundation
Brilliant Corners
Conard House
Delivering Innovation in Supportive Housing (DISH)
Episcopal Community Services
Felton Institute
Freedom Forward
Homebase
HomeFirst Services of Santa Clara County
HomeRise
Hospitality House
Larkin Street Youth Services
Miracle Messages
On the Move
Positive Resource Center
San Francisco Department of
Homelessness and Supportive Housing
San Francisco Department of Public Health
Housing Accelerator Fund
San Francisco Pretrial Diversion Project
San Francisco SafeHouse
Transgender Gender-variant Intersex
Justice Project
Swords To Plowshares
UCSF – Citywide
United Council of Human Services
UpTogether
Initiative Partners
Bay Area Legal Aid
Brilliant Corners
Episcopal Community Services
Larkin Street Youth Services
Mercy Housing
On the Move
Positive Resource Center
San Francisco Adult Probation Department
San Francisco Department of Homelessness and Supportive Housing
San Francisco Department of Public Health
Housing Accelerator Fund
San Francisco Housing Authority
San Francisco Human Services Agency
San Francisco Mayor’s Office of Housing and Community Development
San Francisco Pretrial Diversion Project
San Francisco Sheriff’s Department
Transgender Gender-Variant Intersex Justice Project
Urban Institute
Community Boards
Marc Trotz
National Innovation Service
John Snow, Inc.
Funders Together to End Homelessness

Housing Impact
We believe that San Francisco can be a community where everyone has a safe place to call home. While CHI has come to a close, Tipping Point continues to play a key philanthropic role in addressing homelessness in San Francisco. Explore our housing investments in San Francisco and across the Bay Area.